Test Results
The last step of using the Service Tester is to view the Test Status page. This page will show while the test is running and, once done, the results of the test can be saved to review later, or a text version can be copied to other applications.
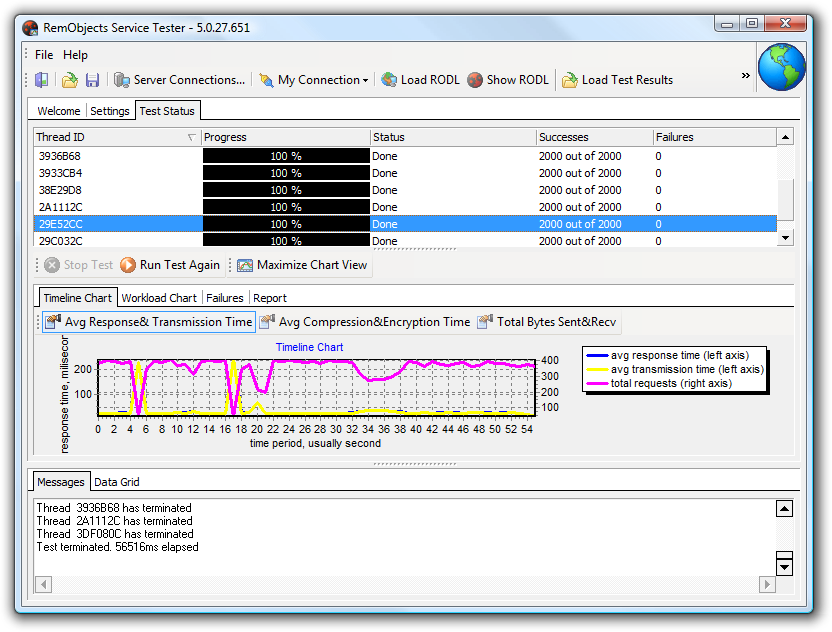
The top grid shows the progress of the running threads. At completion, all threads will be at 100%. Under that there are several tab pages containing the charts and results. The first tab contains the charts showing the time taken by requests, their compression, the total requests per time period and the average compression time.
The second tab contains the workload chart, with results per second.
The third tab contains the Failures (the requests that have failed). Usually this is empty, to show all requests succeeded.
The last tab contains a text version of the charts, which can be copied to other applications.